ThingSpeak
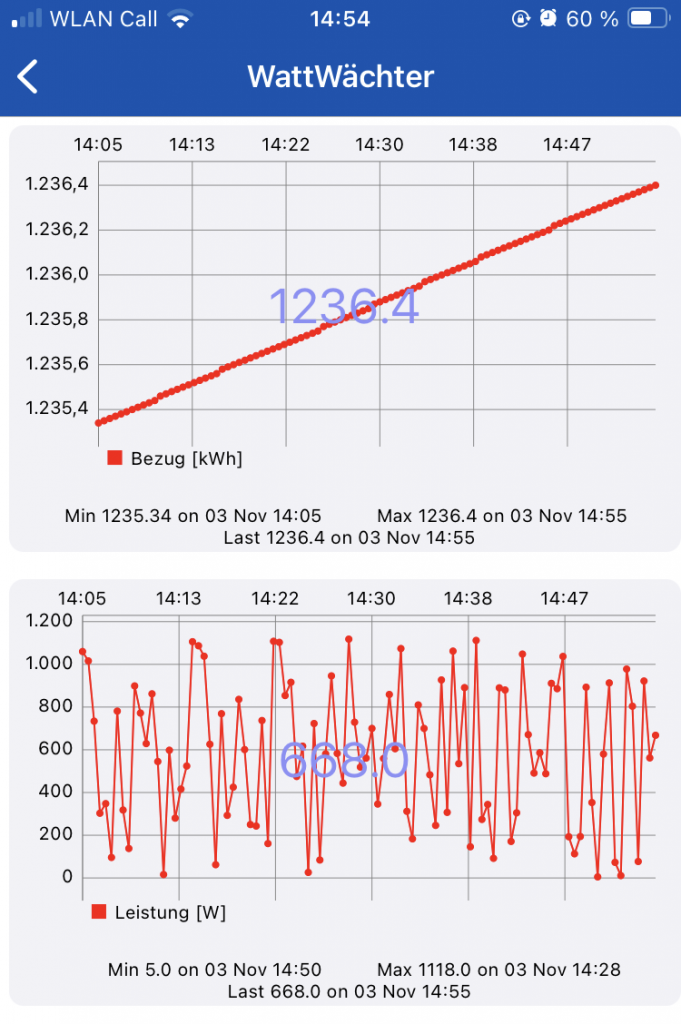
Once the WattWächter WiFi/USB is reading your electricity meter data, you may want to store and visualize it. Not everyone runs a home automation system that can handle this. In that case, you can upload the data to the ThingSpeak cloud and process it there.
The following guide covers the setup in 3 steps. Additional options for processing and displaying data can be found in steps 4 and 5:
- Register with ThingSpeak
- Create a channel
- Adapt the script
- Create bar charts
- Export data
- ThingView app
Register with ThingSpeak
To create a new account at ThingSpeak, open www.ThingSpeak.com and click the "Get Started For Free" button.
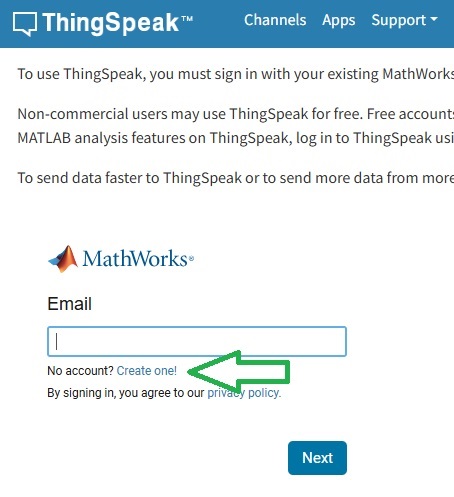
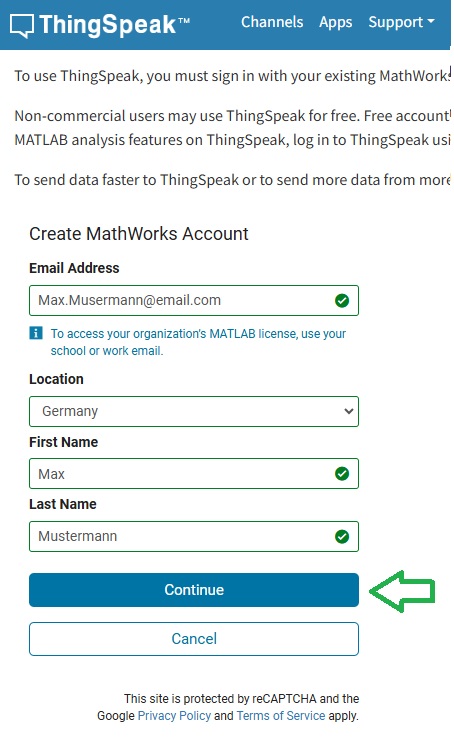
On the next page, click "No Account? Create one" to create a new account. Then fill in your personal details and confirm with "Continue".
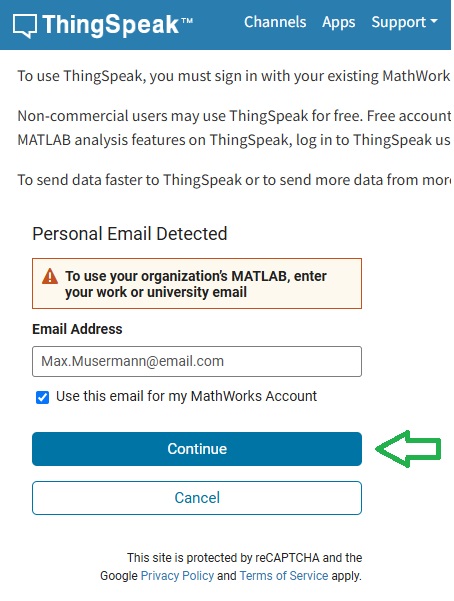
If the "Personal Email Detected" notice appears, check "Use this email for my MathWorks Account" and confirm again with "Continue".
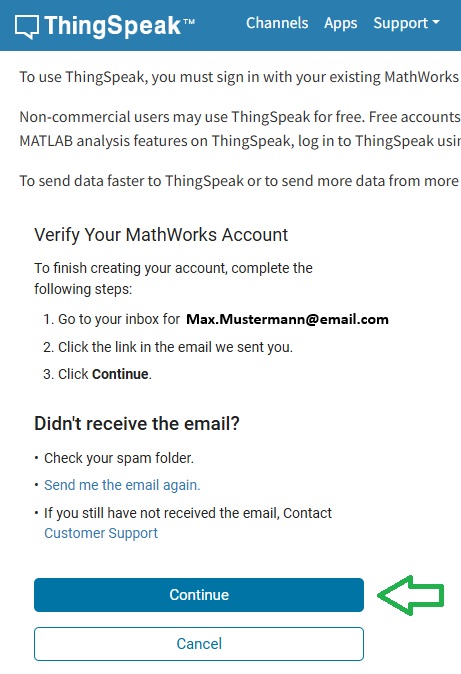
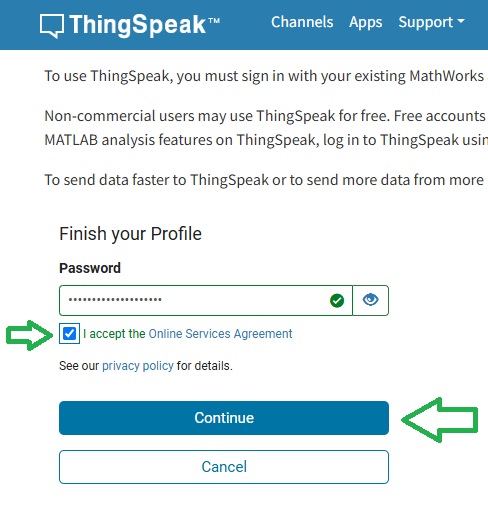
A verification email will be sent to your address. Click "Verify email" in the email, then click "Continue" to set a password.
The "Sign-up successful" page appears. After clicking "OK", you will be taken to the ThingSpeak overview page.
Create a new channel
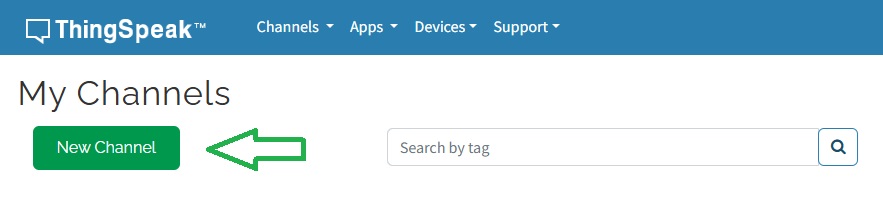
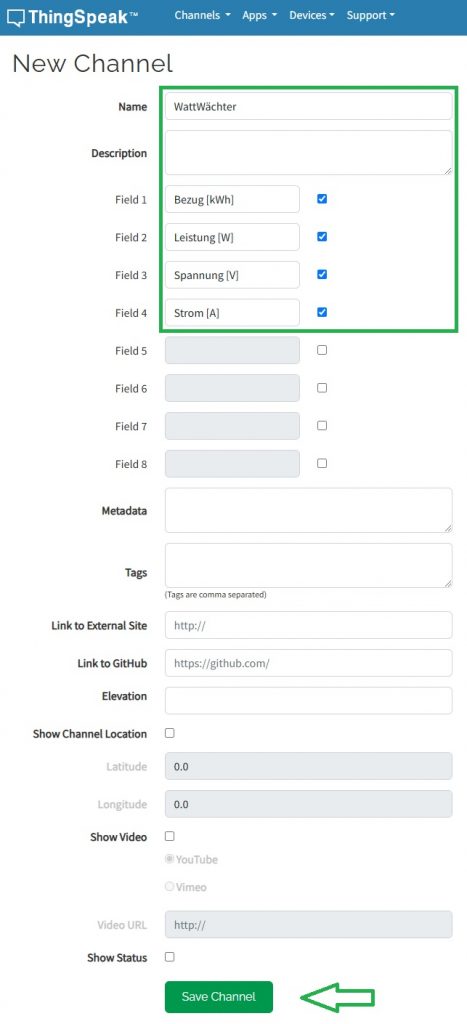
On the ThingSpeak overview page, click the "New Channel" button.
Enter a name and optionally a description for the channel. Each channel can have up to eight fields. In the following example, four fields were defined for consumption, power, feed-in and current. Click "Save Channel" to save.
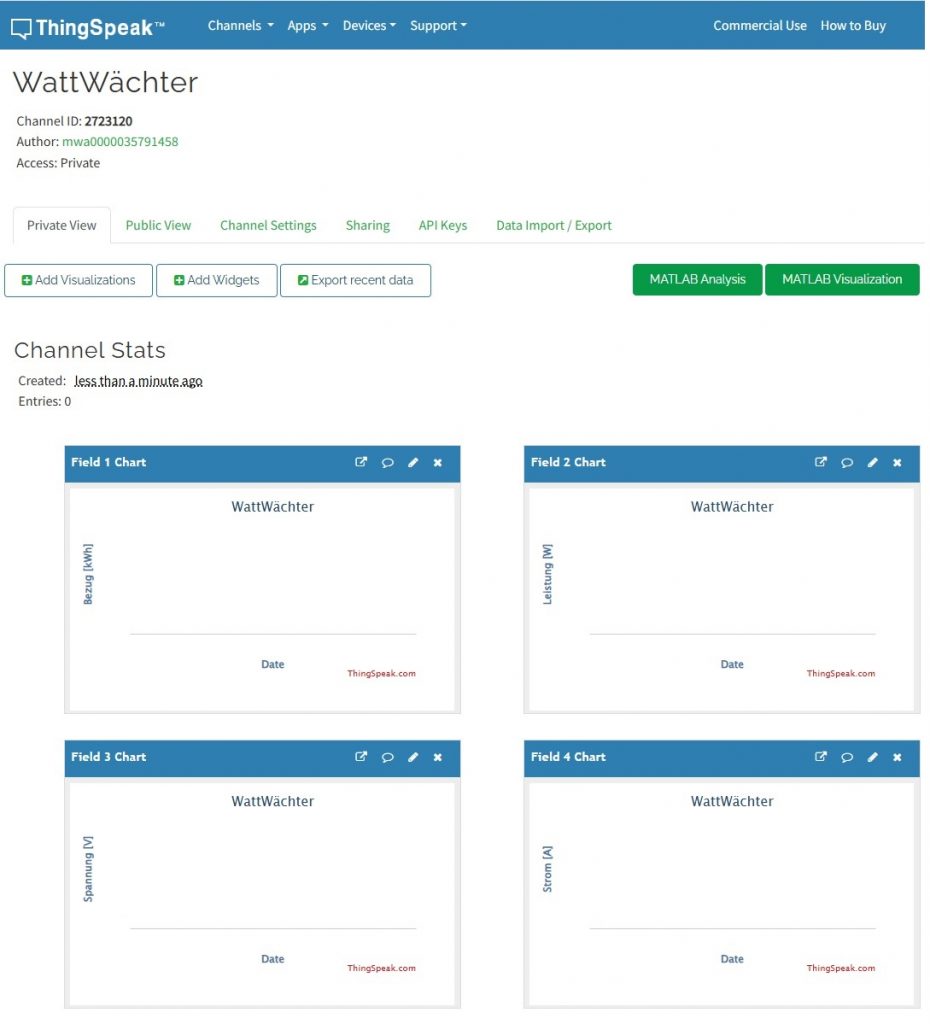
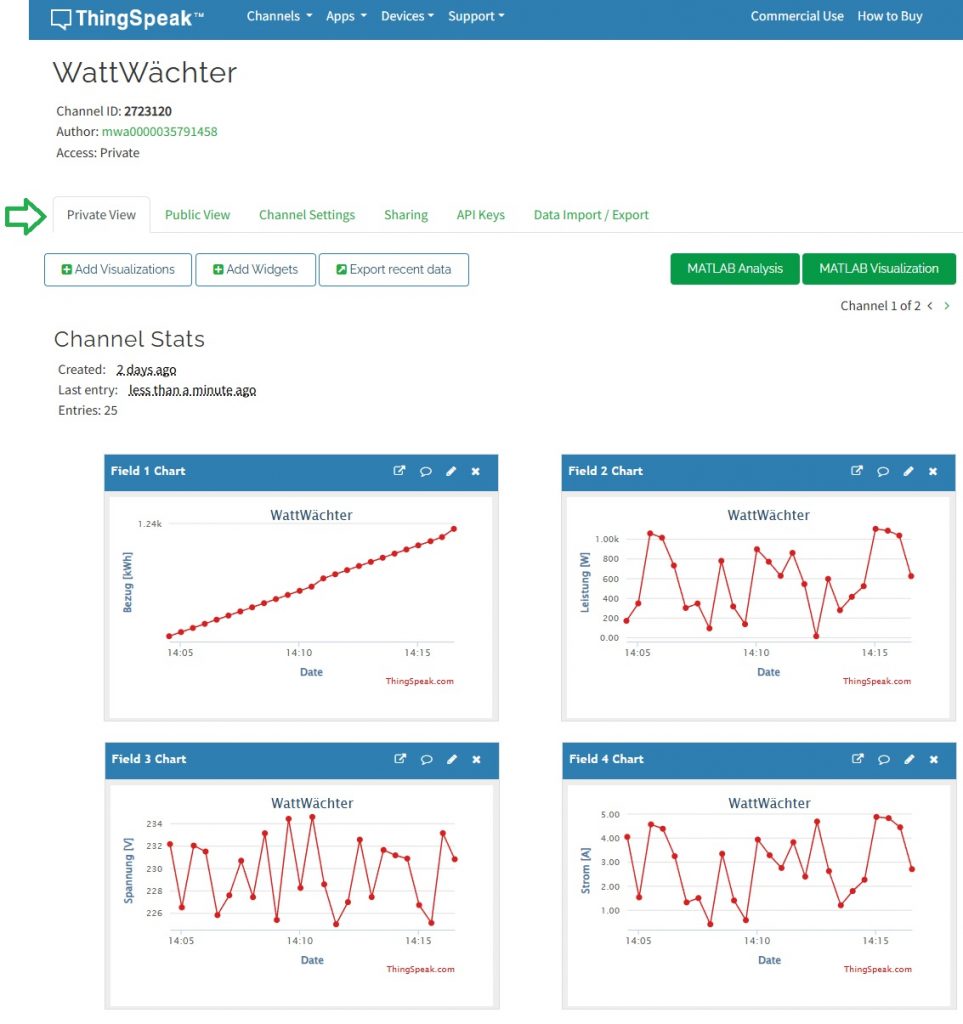
The channel overview opens with trend charts already created.
Adapt the script
Now the script needs to be adapted so that data is sent to the ThingSpeak cloud. Go to "Tools" => "Edit Script". The following example uses a script for the Hager EHZ361 meter.
Insert the following code block between >S and >M 1:
>S
if upsecs%30==0
  then
    =>WebSend [api.thingspeak.com] /update.json?api_key=WriteKey&field1=%sml[1]%&field2=%sml[2]%&field3=%sml[3]%&field4=%sml[4]%
endif
The following values need to be adapted:
-
30-- How often values are sent to ThingSpeak (in seconds).Important
For the free ThingSpeak account, this value must not be less than 15 seconds.
-
WriteKey-- The write API key for your channel, found in ThingSpeak under "API Keys".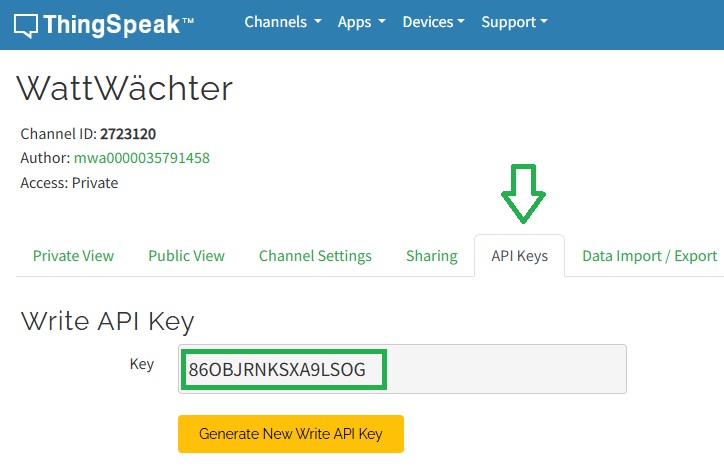
-
field1-X-- Corresponds to the channel fields created above.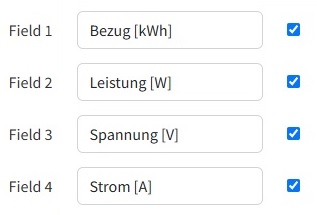
-
sml[1-X]-- Corresponds to the lines in the decoding section of the script.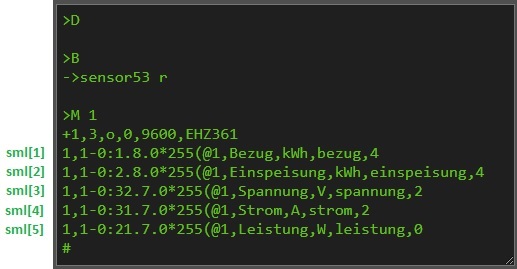
The channel fields and script lines must be mapped correctly:
| Measurement | Channel field | Script line |
|---|---|---|
| Consumption | field1 | sml[1] |
| Power | field2 | sml[5] |
| Voltage | field3 | sml[3] |
| Current | field4 | sml[4] |
Note
The following example is for illustration only. You will need your own API key and likely a different mapping.
>S
if upsecs%30==0
  then
    =>WebSend [api.thingspeak.com] /update.json?api_key=86OBJRNKSXA9LSOG&field1=%sml[1]%&field2=%sml[5]%&field3=%sml[3]%&field4=%sml[4]%
endif
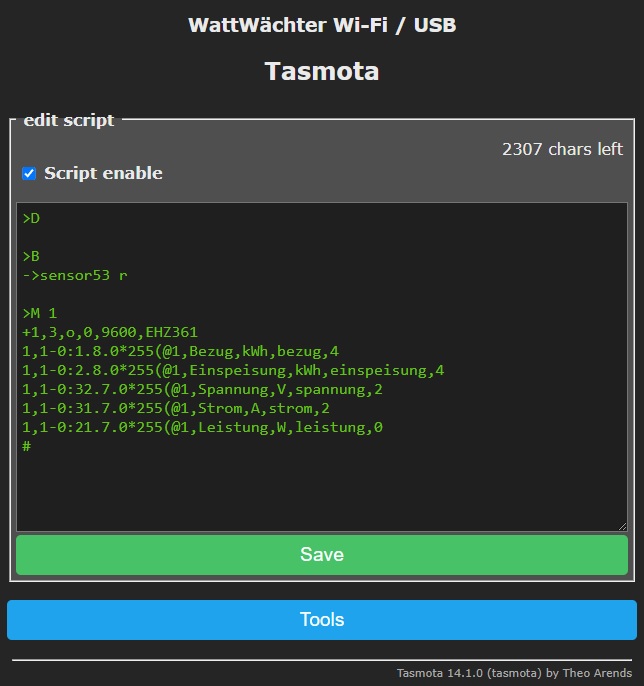
The complete script in Tasmota looks like this:
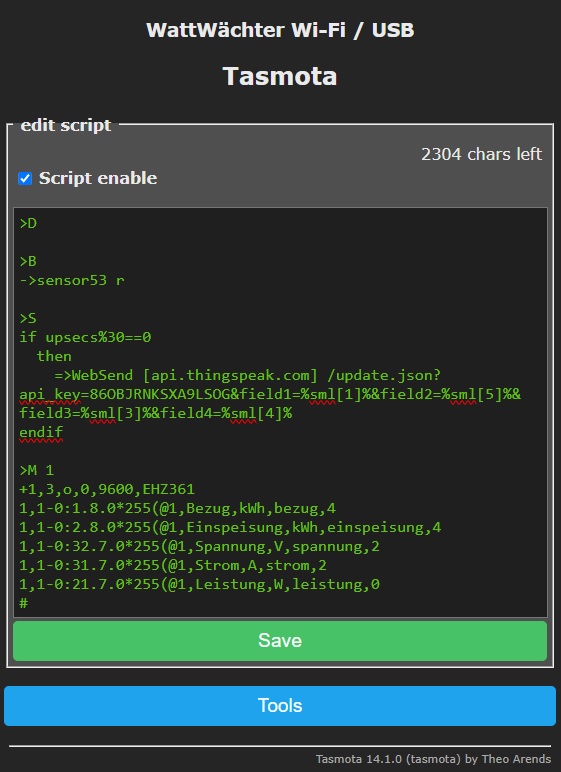
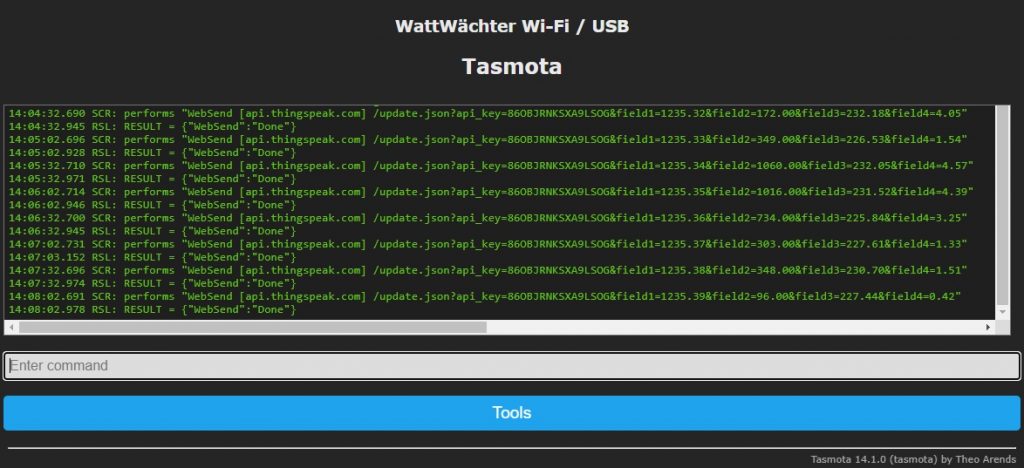
In the console (Main menu => Tools => Console), you can see a data set being sent to ThingSpeak every 30 seconds:
The data is displayed as charts in ThingSpeak after clicking "Private View":
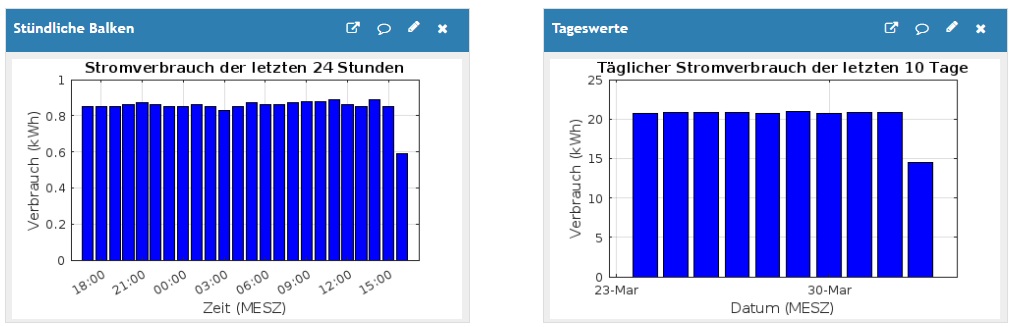
Create bar charts
To create bar charts showing hourly consumption over the last 24 hours or daily consumption over the last 10 days, you can use the built-in MATLAB functionality.
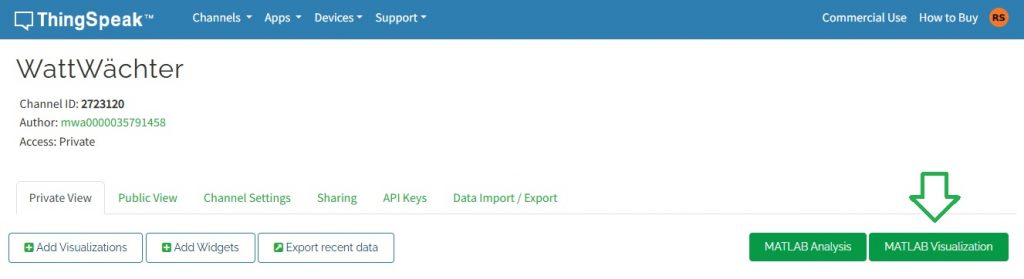
Click the "MATLAB Visualization" button in your channel.
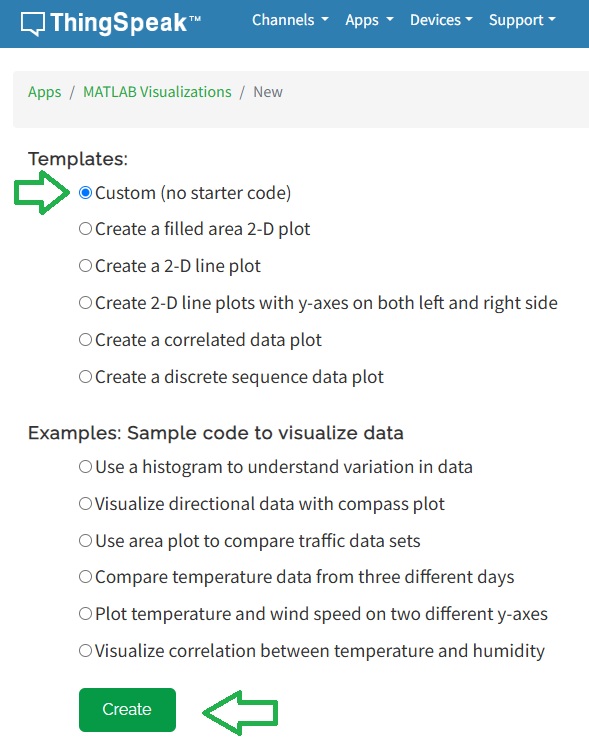
In the dialog, keep the default "Custom" setting and click "Create".
In the next dialog, enter a name for the module and paste the MATLAB code. In the first three lines of the code, set the channelID, fieldID and readAPIKey. The field ID must refer to the field storing the consumed kWh (in the example, field 1: consumption).
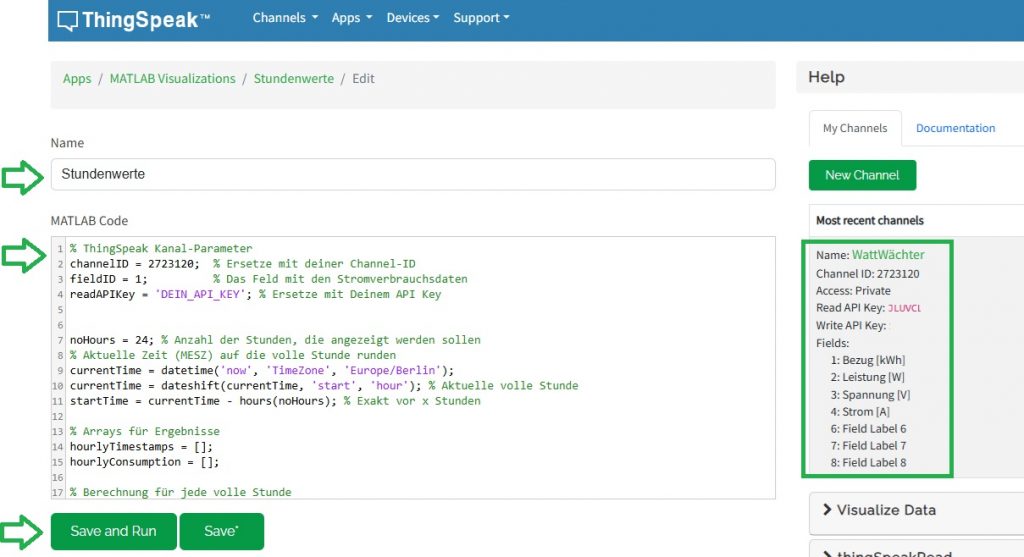
MATLAB code for hourly bars
% ThingSpeak channel parameters
channelID = YOUR_CHANNELID;  % Replace with your Channel ID
fieldID = 1;          % The field with power consumption data
readAPIKey = 'YOUR_API_KEY'; % Replace with your API key

noHours = 24; % Number of hours to display
currentTime = datetime('now', 'TimeZone', 'Europe/Berlin');
currentTime = dateshift(currentTime, 'start', 'hour');
startTime = currentTime - hours(noHours);

hourlyTimestamps = [];
hourlyConsumption = [];

for h = 1:noHours
    hourStart = startTime + hours(h);
    hourEnd = hourStart + hours(1);

    if hourEnd > datetime('now', 'TimeZone', 'Europe/Berlin')
        hourEnd = datetime('now', 'TimeZone', 'Europe/Berlin');
    end

    data = thingSpeakRead(channelID, 'Fields', fieldID, 'DateRange', [hourStart, hourEnd], ...
                          'ReadKey', readAPIKey, 'OutputFormat', 'table');

    if ~isempty(data)
        firstValue = data.(2)(1);
        lastValue = data.(2)(end);
        consumption = lastValue - firstValue;
    else
        consumption = 0;
    end

    hourlyTimestamps = [hourlyTimestamps; hourStart];
    hourlyConsumption = [hourlyConsumption; consumption];
end

figure;
bar(hourlyTimestamps, hourlyConsumption, 'b');
xlabel('Time');
ylabel('Consumption (kWh)');
title(sprintf('Power consumption over the last %d hours', noHours));
grid on;
datetick('x', 'HH:MM', 'keeplimits');
MATLAB code for daily bars
% ThingSpeak channel parameters
channelID = YOUR_CHANNELID;  % Replace with your Channel ID
fieldID = 1;          % The field with power consumption data
readAPIKey = 'YOUR_API_KEY'; % Replace with your API key

noDays = 10; % Number of days to display
currentTime = datetime('now', 'TimeZone', 'Europe/Berlin');
currentTime = dateshift(currentTime, 'start', 'day');
startTime = currentTime - days(noDays);

dailyTimestamps = [];
dailyConsumption = [];

for d = 1:noDays
    dayStart = startTime + days(d);
    dayEnd = dayStart + days(1);

    if dayEnd > datetime('now', 'TimeZone', 'Europe/Berlin')
        dayEnd = datetime('now', 'TimeZone', 'Europe/Berlin');
    end

    data = thingSpeakRead(channelID, 'Fields', fieldID, 'DateRange', [dayStart, dayEnd], ...
                          'ReadKey', readAPIKey, 'OutputFormat', 'table');

    if ~isempty(data)
        firstValue = data.(2)(1);
        lastValue = data.(2)(end);
        consumption = lastValue - firstValue;
    else
        consumption = 0;
    end

    dailyTimestamps = [dailyTimestamps; dayStart];
    dailyConsumption = [dailyConsumption; consumption];
end

figure;
bar(dailyTimestamps, dailyConsumption, 'b');
xlabel('Date');
ylabel('Consumption (kWh)');
title(sprintf('Daily power consumption over the last %d days', noDays));
grid on;
datetick('x', 'dd-mmm', 'keeplimits');
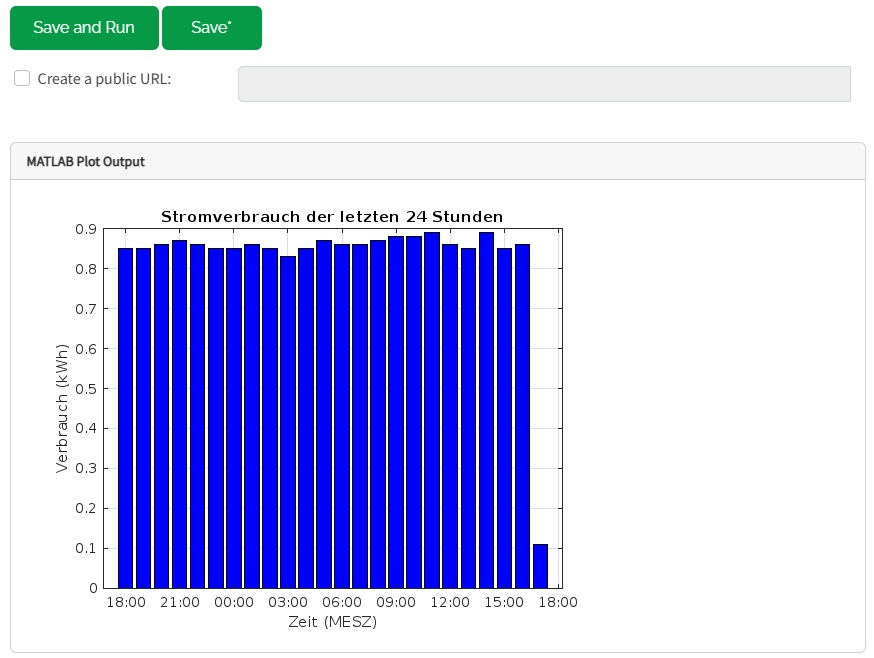
Click "Save and Run" to verify everything works.
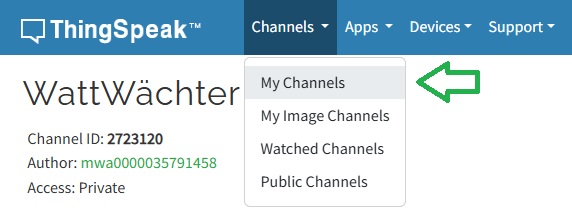
Navigate back to your channel via "Channels" => "My Channels".
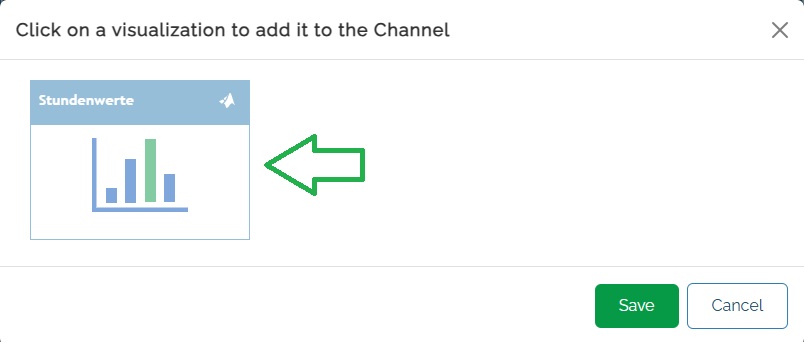
Select your channel and click "Add Visualization" to add the chart to the overview.
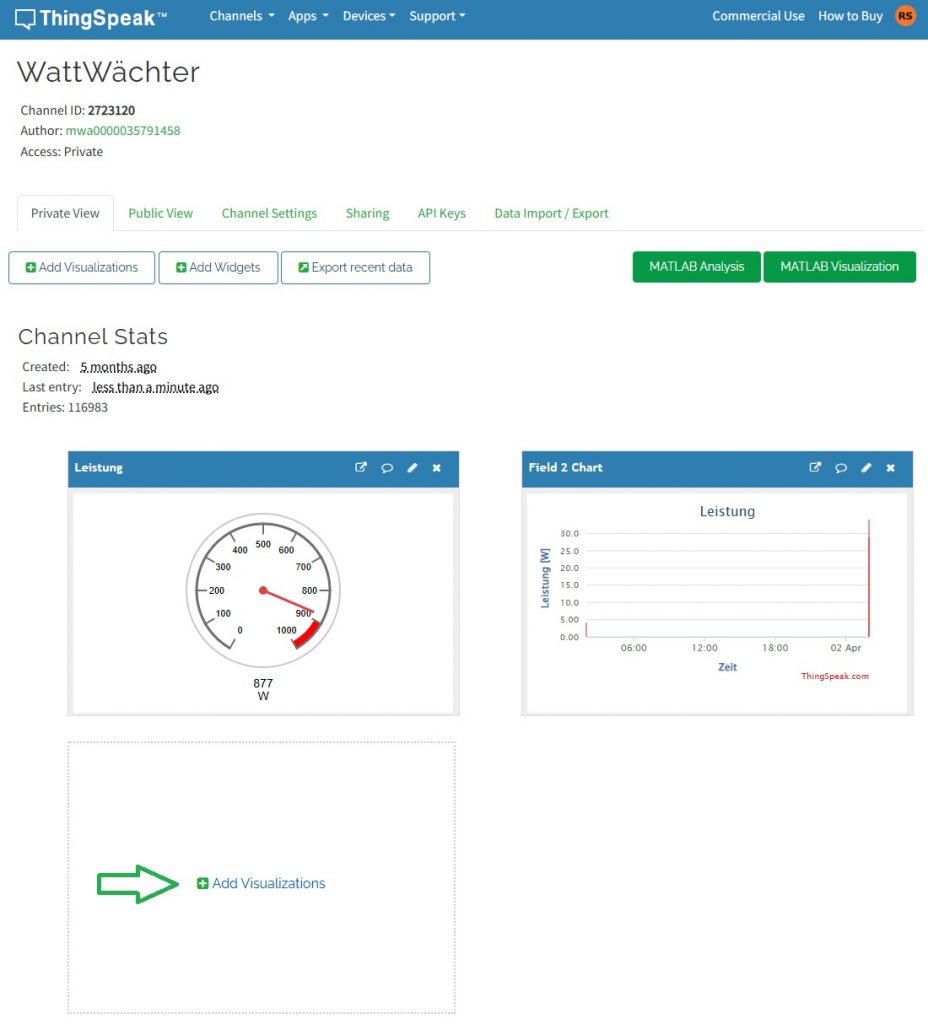
Select the chart and click "Save" to add it to the overview.
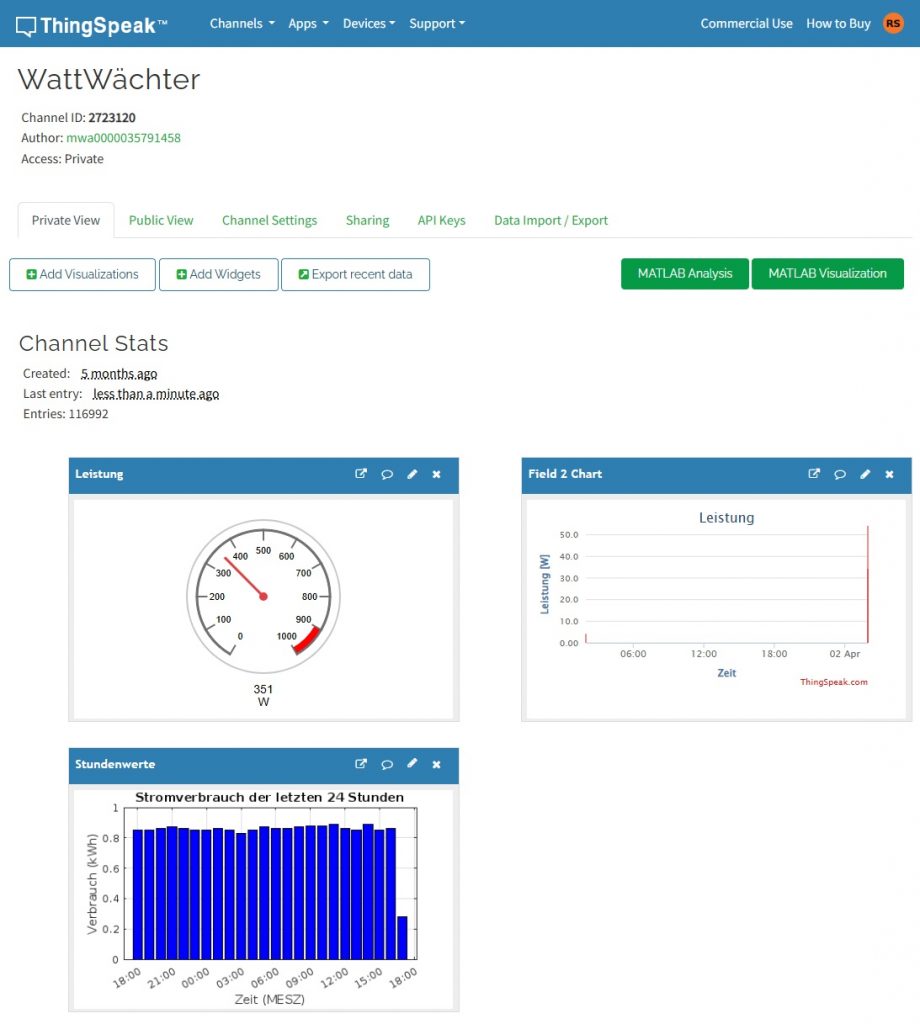
The result should look like this:
Export data
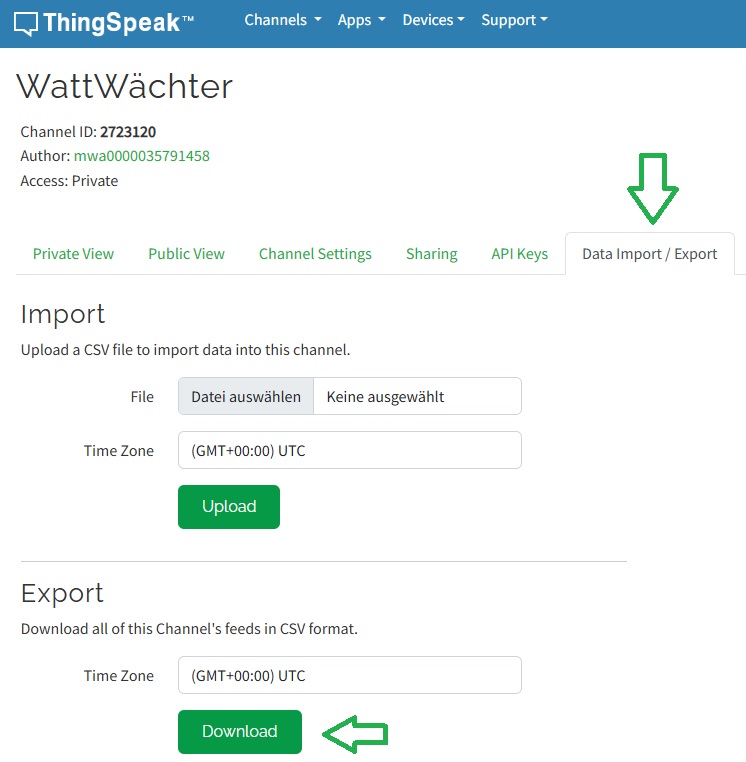
To export the data stored in ThingSpeak, e.g. for analysis in Excel, go to the "Data Import / Export" section of your channel. Click "Download" in the "Export" section to download all stored data as a CSV file.
ThingView app
The ThingSpeak website is accessible worldwide via any browser. For easier access, you can download the paid ThingView app:
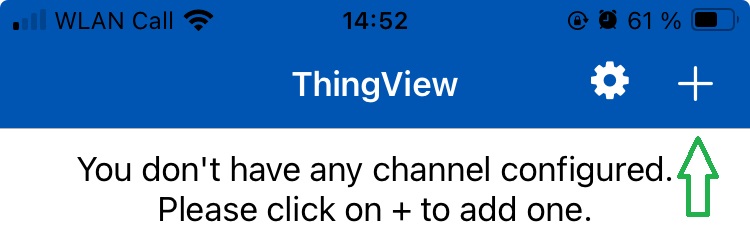
On the app's start screen, tap "+" to add a new channel.
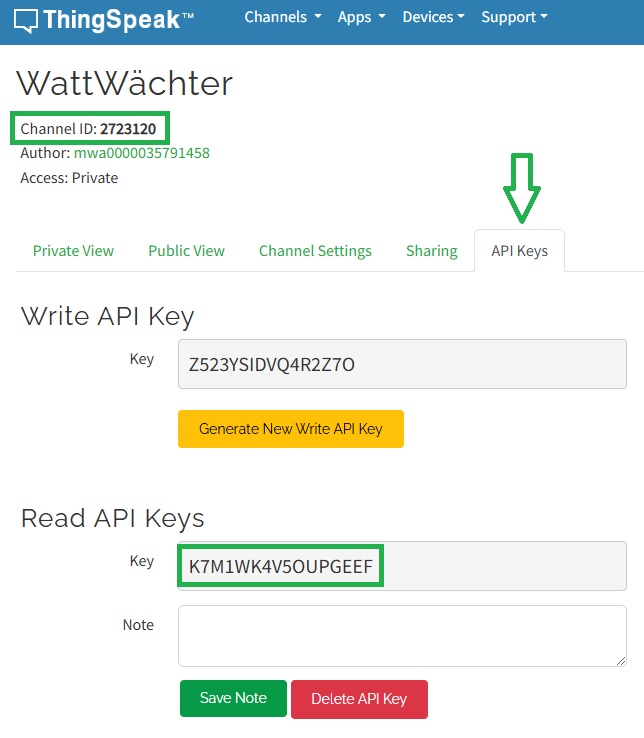
The channel ID can be found in ThingSpeak below the channel name. Since the channel is private by default, disable "Public" and enter the read API key from ThingSpeak (found under "API Keys" => "Read API Keys").
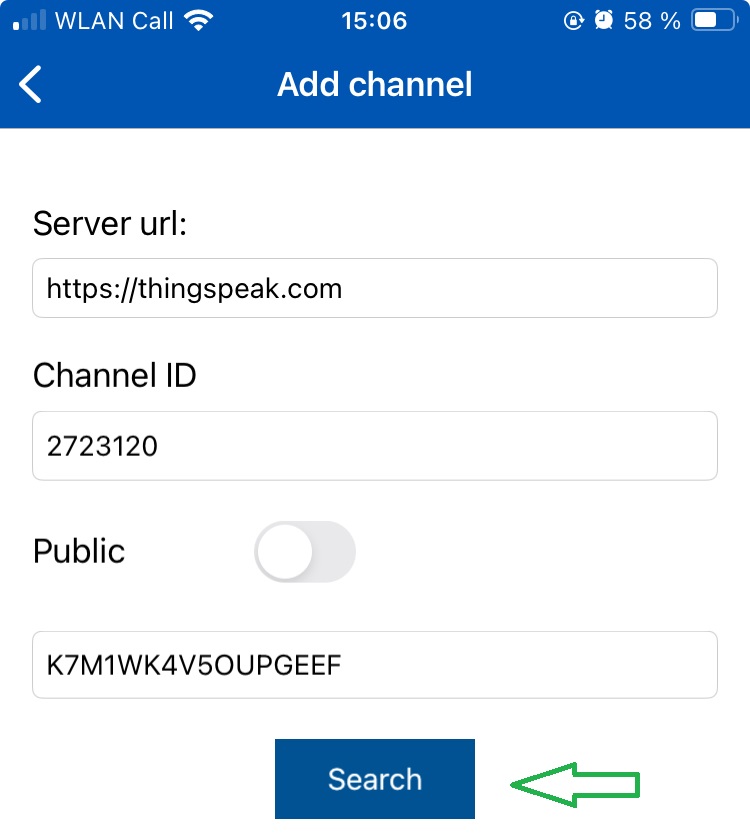
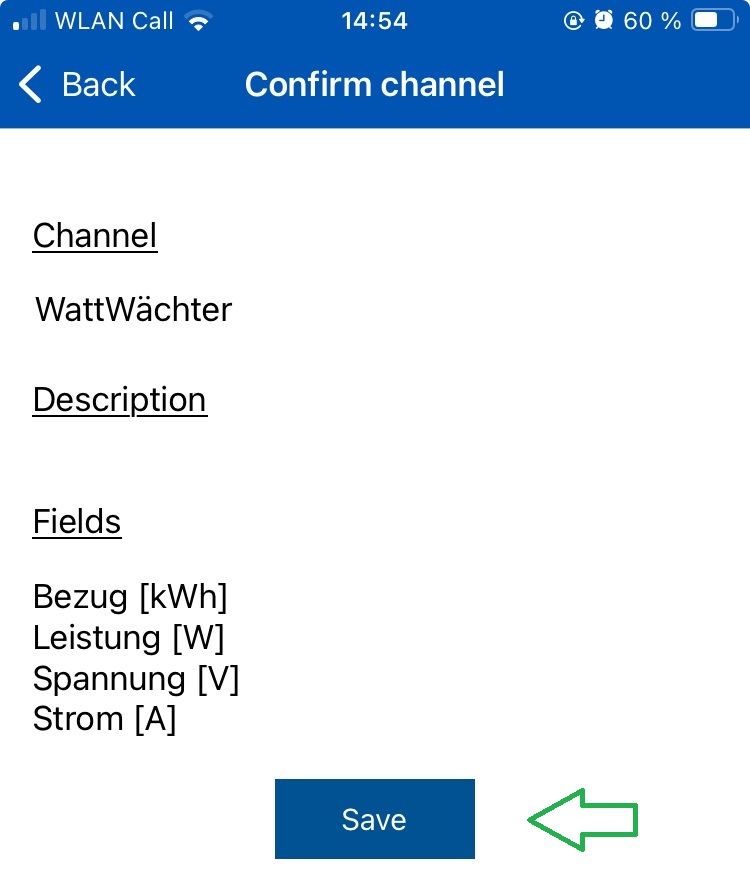
After clicking "Search", confirm the channel on the next page. Then select the channel once more.
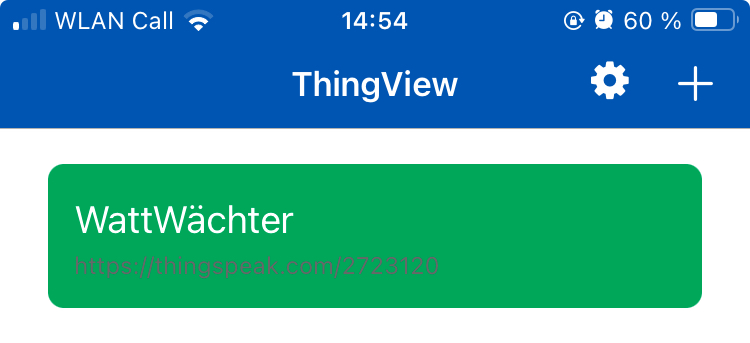
The trends are now displayed in the app: