Web Interface
The WattWächter Plus features a built-in web interface (WebUI) accessible via any browser on your local network.
Access
Open in your browser:
http://wattwaechter-XXXXXXXXXXXX.local
What does XXXXXXXXXXXX mean?
The twelve X's represent your WattWächter's individual device ID (the last 12 characters of its MAC address, hexadecimal). You can find it e.g. in the Cloud Portal or in the app.
Alternatively, you can use the IP address directly. How to find the mDNS name or IP address of your WattWächter is described in our FAQ.
The following home page will open:
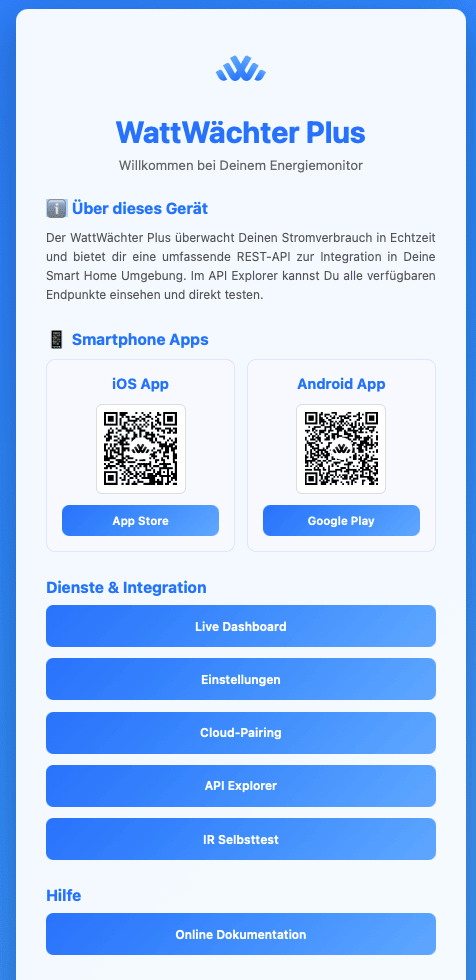
Services & Integration
The following features are accessible through the web interface:
Dashboard
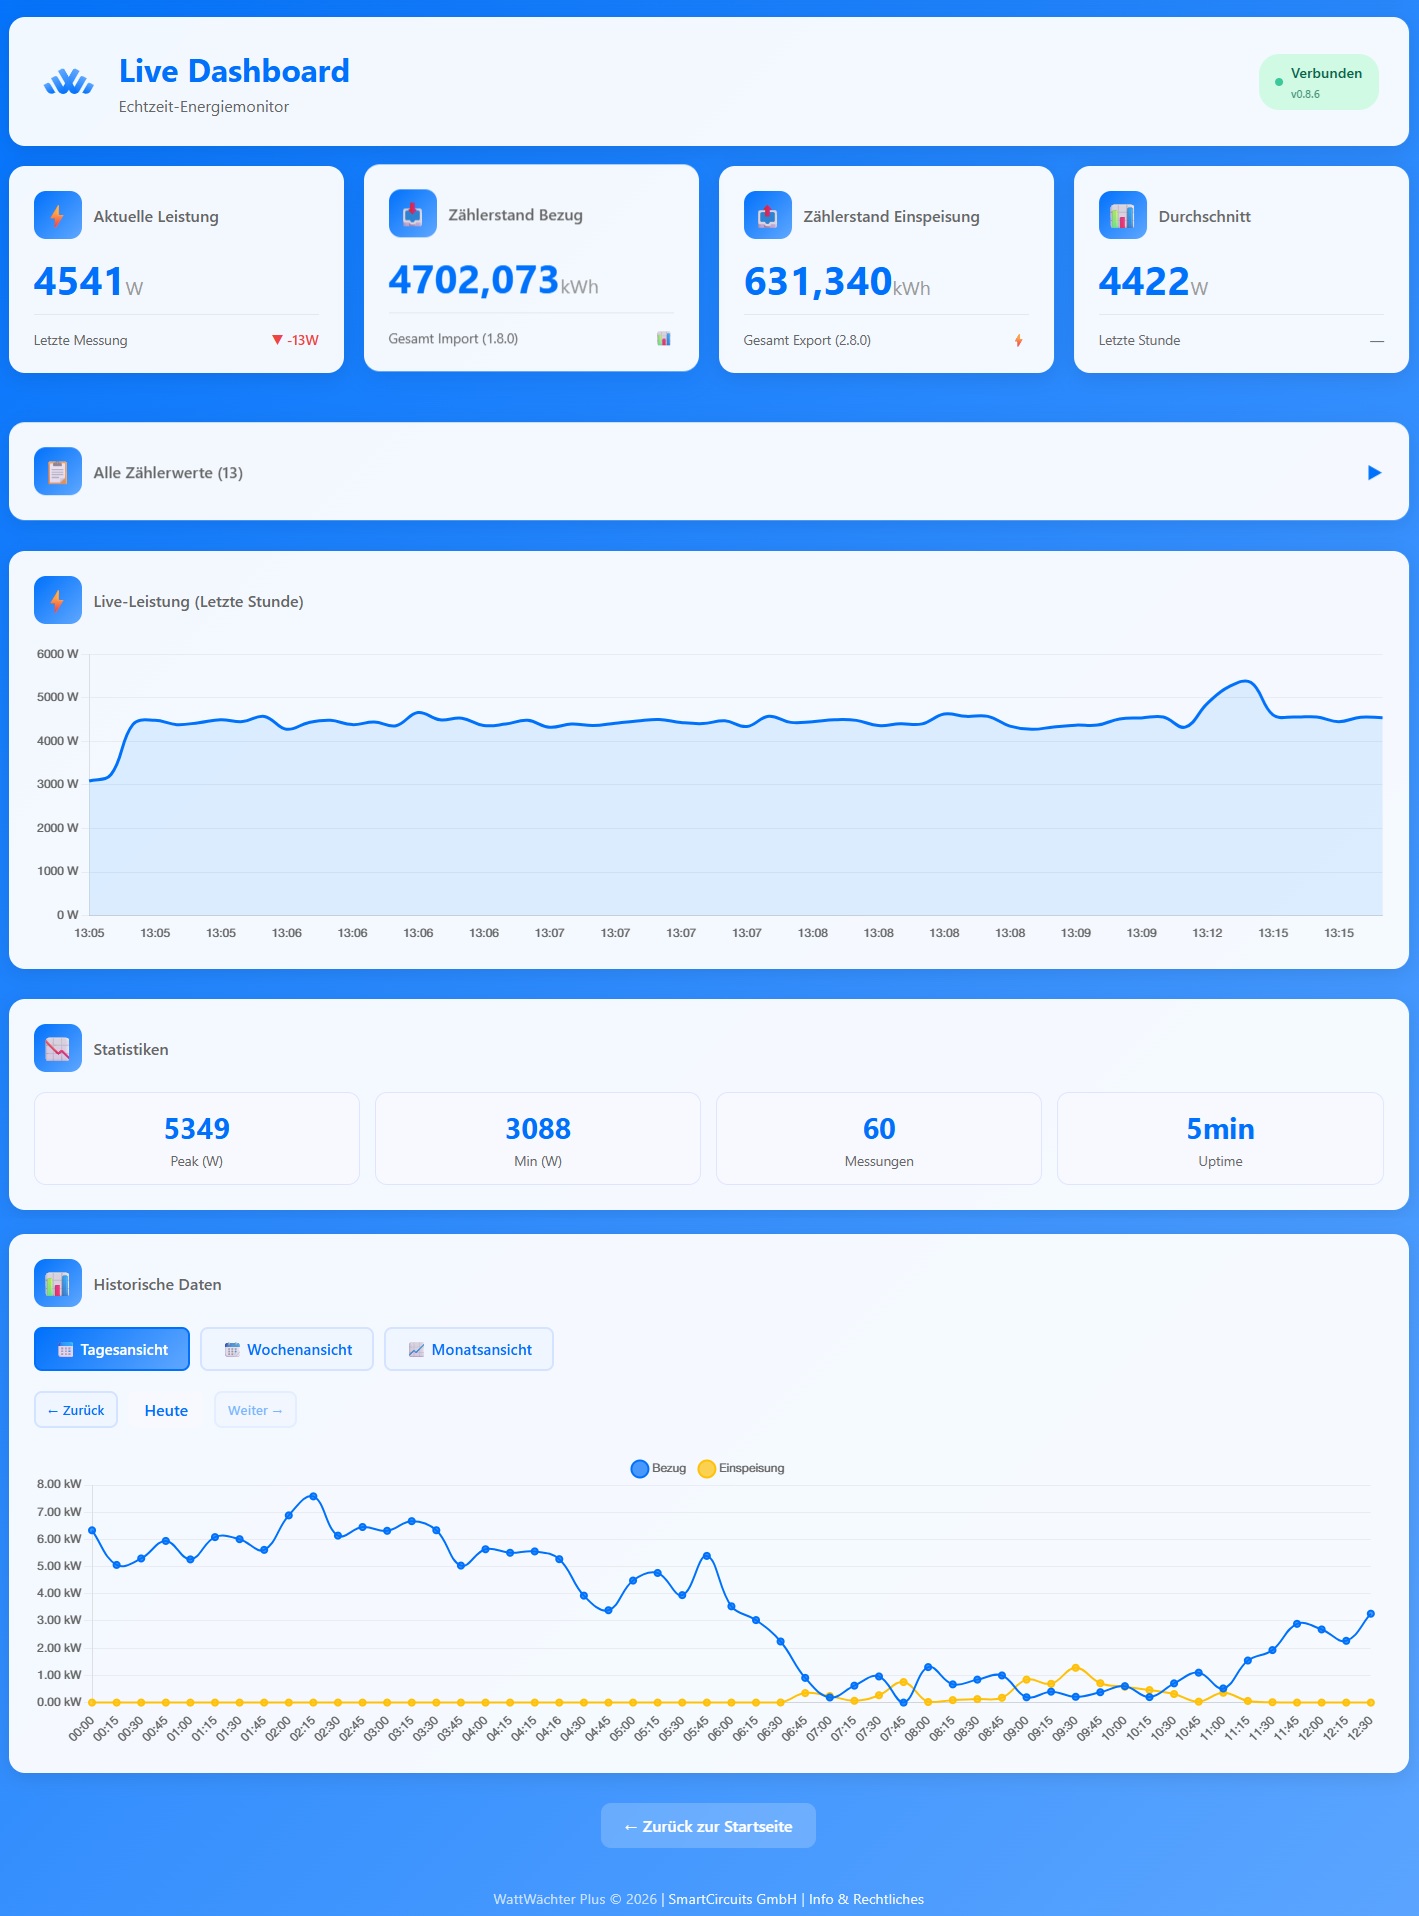
The dashboard is the main view of the web interface and shows your energy data in real time.
Authentication
If API authentication is enabled, you will be prompted for an API token when opening the dashboard. Enter the READ Token to view data.
Live Data
- Current Power — Instantaneous consumption or feed-in in watts
- Meter Reading (Import) — Cumulative total consumption (OBIS
1-0:1.8.0) - Meter Reading (Export) — Cumulative total feed-in (OBIS
1-0:2.8.0) - Average Power — Mean value over the observation period
- Power Trend — Arrow indicating whether consumption is rising or falling
Live data is automatically updated every 5 seconds.

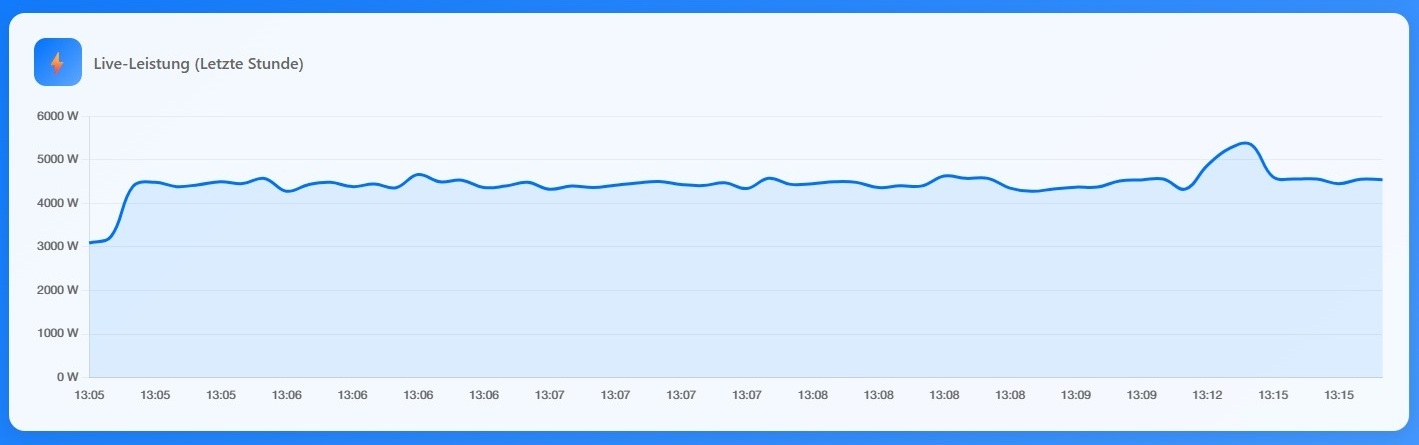
Live Chart
A line chart shows the power trend over the last 60 minutes. Hover over a data point to see the exact values.
All Meter Values
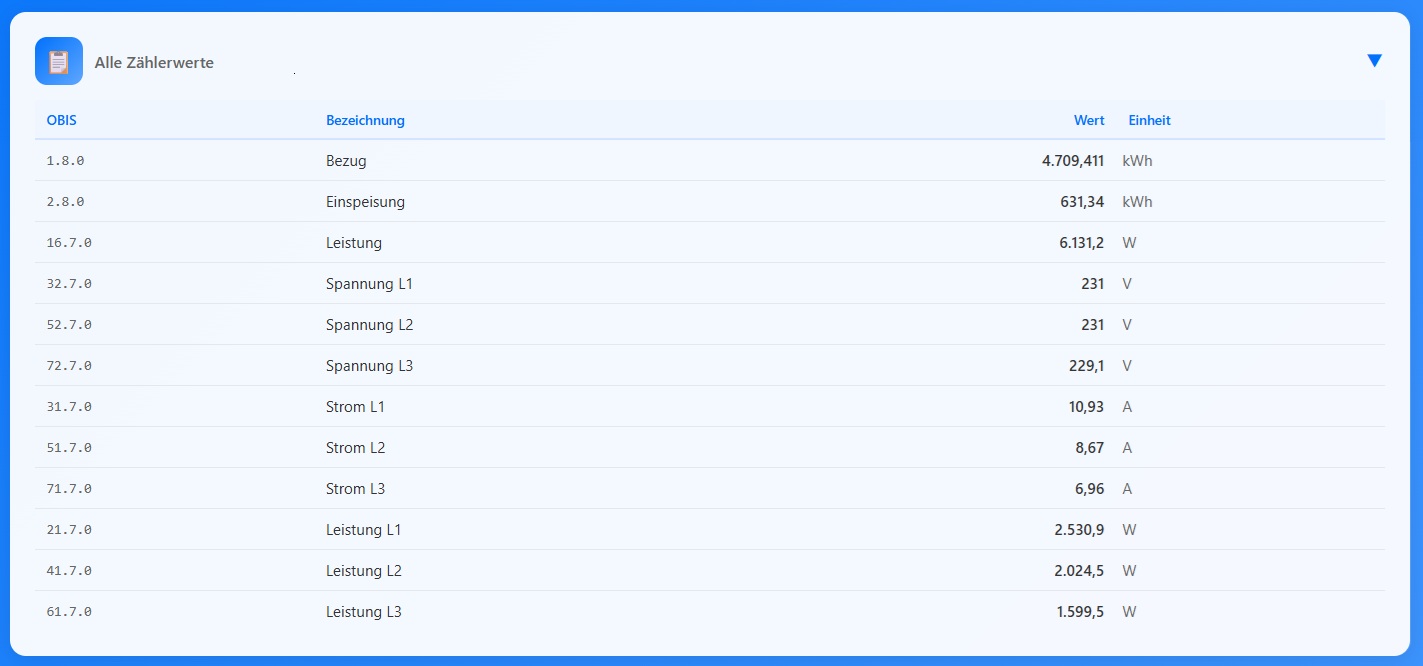
An expandable section lists all OBIS codes received from the meter, including description, current value, and unit. This shows you which data your meter actually provides.
Statistics
- Peak Power — Maximum power in the last hour
- Minimum Power — Lowest power in the last hour
- Measurements — Number of data points received
- Uptime — Device runtime since last reboot

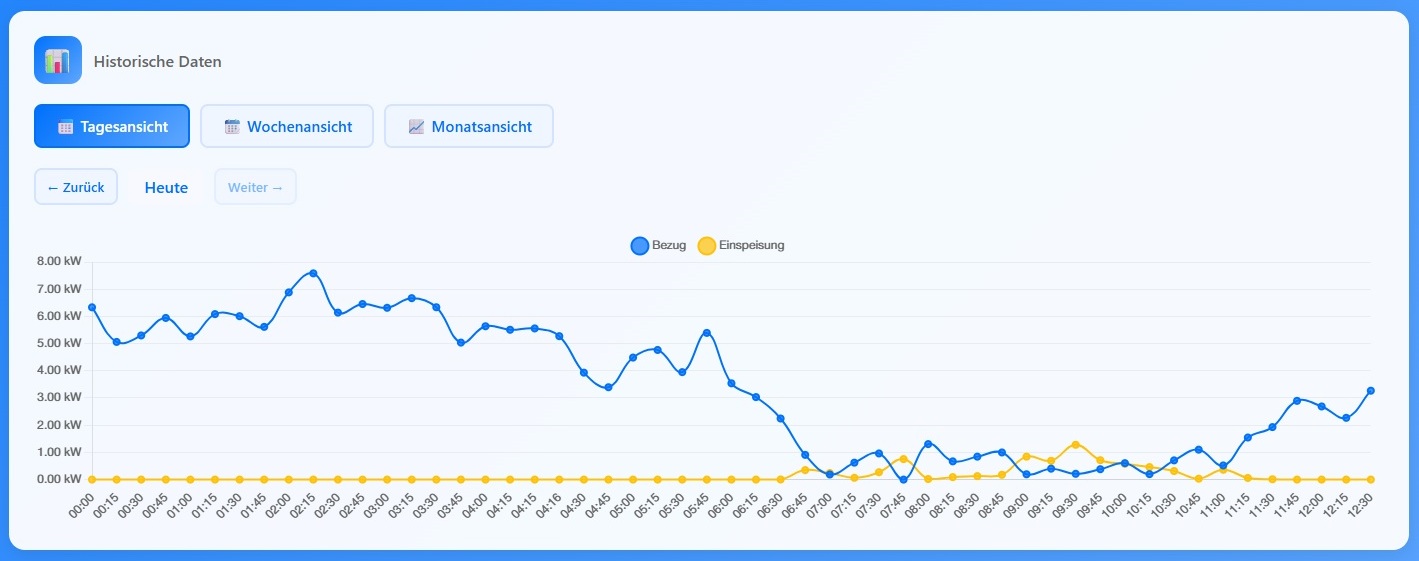
Historical Data
Below the live data, you'll find historical analysis in three views:
| View | Resolution | Time Range | Chart Type |
|---|---|---|---|
| Day | 15 minutes | 1 day (up to 30 days back) | Line chart |
| Week | Daily totals | 7 days | Bar chart |
| Month | Daily totals | 1 month | Bar chart |
Each view shows Import (consumption) and Export (feed-in) as separate data series. Use the previous/next buttons to navigate through time periods.
Settings
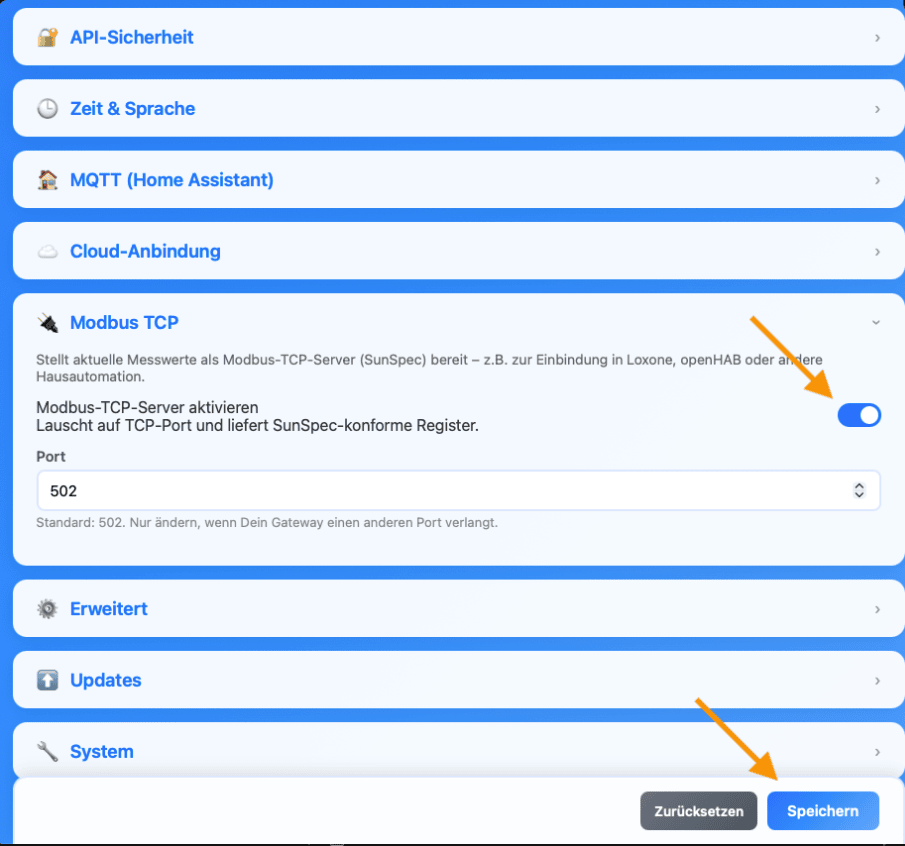
The "Settings" button opens the device configuration with eleven sections. Each can be expanded individually; changes only take effect once you press Save at the bottom of the page, and Reset discards them.
| Section | Documentation |
|---|---|
| Device | Settings → Device — device name, status LED |
| WiFi | Settings → WiFi — primary and secondary WiFi, static IP |
| Access point | Settings → Access point |
| API security | Settings → API security |
| Time & language | Settings → Time & language — time zone, language, NTP server |
| MQTT (Home Assistant) | Interfaces → MQTT |
| Cloud connection | Settings → Cloud connection, Cloud Portal → Pairing a device |
| Modbus TCP | Interfaces → Modbus TCP |
| Advanced | Settings → Advanced — median filter, CT ratio |
| Updates | Settings → Updates, Software updates |
| System | Settings → System — restart |
Example: the expanded Modbus TCP section with its toggle, port field and the Save button.
→ What the individual settings do: Settings
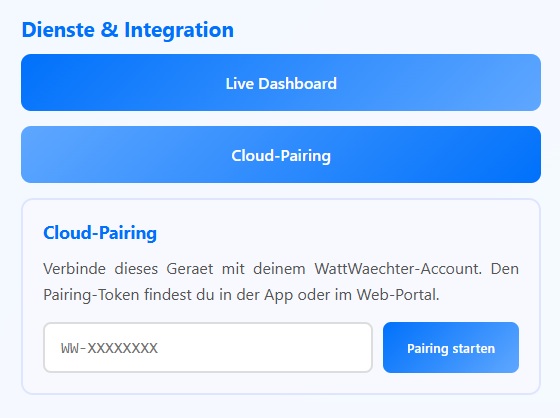
Cloud Pairing
Connect your WattWächter to the Cloud Portal by entering the pairing token (format: WW-XXXXXXXX) into the input field and clicking "Start Pairing".
→ Detailed guide: Cloud Portal → Pair a Device
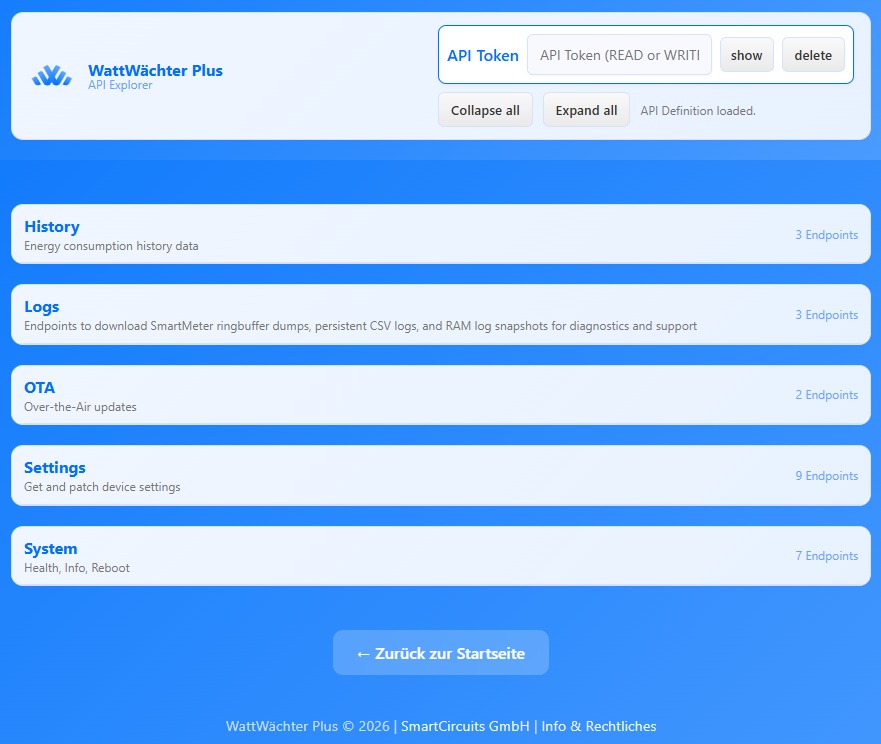
API Explorer
The "API Explorer" button opens an interactive API documentation that lets you test all REST endpoints directly in your browser.
- All available endpoints with HTTP method (GET, POST, DELETE)
- Security status (token required / public)
- Request/response schemas
- Input fields for parameters and request body
- Direct execution with response display
→ Full API documentation: REST API
IR Self-Test
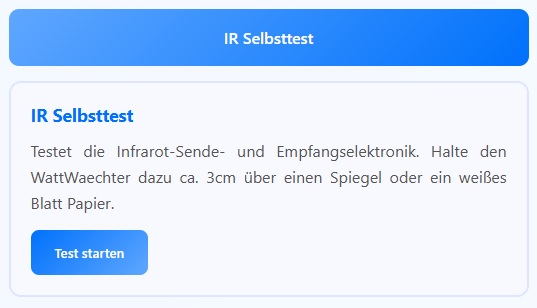
Tests the infrared transmit and receive electronics of the WattWächter. Hold the device about 3 cm above a mirror or a white sheet of paper and click "Start Test". The test sends a bit pattern via IR and checks whether it is correctly reflected back. After up to 5 attempts, the result is displayed.
Help
The "Online Documentation" button takes you directly to this documentation site.
Info & Legal
The "Info & Legal" link at the bottom of the page provides the following information:
- Manufacturer Information — SmartCircuits GmbH, contact details
- Open Source Licenses — Libraries used and their licenses
- Usage Notices — Notes on calibration, privacy, and power supply